
In MATLAB® graphics, titles are displayed in a bold, slightly larger font for improved visibility. However, this can cause longer titles to overflow and not fit within the figure window’s boundaries. For instance, the following code generates a plot with a title that exceeds the figure window’s size.
plot(1:10);
title(['This is a title that is too long and does not fit', ...
    'within the extents of the figure window.'])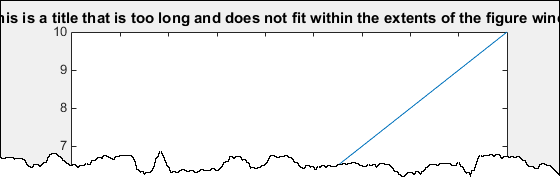
The title font size is determined by the TitleFontSizeMultiplier and FontSize properties of the axes. By default, the FontSize is set to 10 points, and the TitleFontSizeMultiplier is 1.100, resulting in a title font size of 11 points.
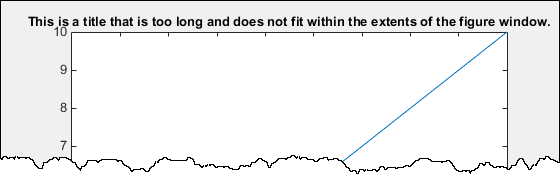
To adjust the title font size independently of the other text in the axes, modify the TitleFontSizeMultiplier property. For instance, you can change the title’s font size to match the size of the other text in the axes.

plot(1:10);
title(['This is a title that is too long and does not fit', ...
    'within the extents of the figure window.'])
ax = gca;
ax.TitleFontSizeMultiplier = 1;
To reduce the font size for the entire axes, adjust the FontSize property. Modifying this property will change the font size for the title, tick labels, and axis labels, if present.
plot(1:10);
title(['This is a title that is too long and does not fit', ...
    'within the extents of the figure window.'])
ax = gca;
ax.FontSize = 8;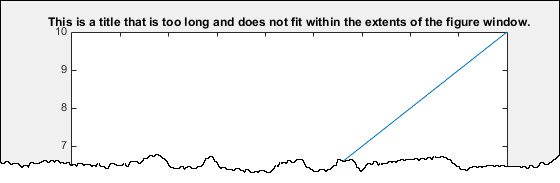
To display the title on two lines, use a cell array with curly brackets {} to specify a multiline title.
plot(1:10);
title({'This is a title that is too long and does not fit', ...
    'within the extents of the figure window.'})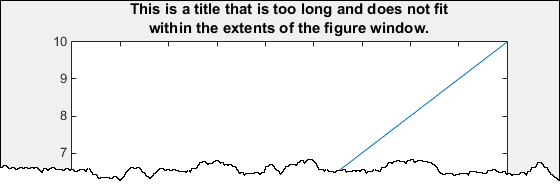
Frequently Asked Questions
Why should I make my graph title smaller?
Making the graph title smaller can improve the overall readability and aesthetics of your chart. A smaller title ensures that the data itself takes center stage without distraction.
How can I change the size of a graph title?
You can adjust the title size in most graphing software or tools like Excel, Google Sheets, or other data visualization platforms by selecting the title text and changing the font size settings.
What is the best font size for a graph title?
The ideal font size for a graph title is typically 1.5 to 2 times the size of the axis labels. This helps the title remain readable without overshadowing the graph’s content.
Can I make the graph title smaller in Excel?
Yes, in Excel, you can change the font size of the graph title by clicking on the title, then using the font size tool on the ribbon or right-clicking to access the title formatting options.
Is it necessary to make the graph title smaller?
While it’s not mandatory, making the graph title smaller can make your graph look cleaner and more professional, especially in presentations or reports with limited space.
What is the impact of a smaller title on graph readability?
A smaller title prevents the title from competing for attention with the data, allowing the audience to focus more on the information being presented rather than the title.
Can I change the font style of the graph title as well as the size?
Yes, most graphing tools allow you to change both the font style and size. Choose a clean, legible font that doesn’t overpower the graph.
How do I ensure the graph title fits within the available space?
You can adjust the font size proportionally or shorten the title itself. Alternatively, using a subtitle or breaking the title into two lines can help fit it into the available space.
Is there a recommended font size for a graph title in presentations?
For presentations, a font size of 18–24 points is often recommended for titles. However, this can vary depending on the font style and the size of the presentation screen.
How can I make the graph title smaller in Google Sheets?
In Google Sheets, click on the graph title, then use the toolbar to adjust the font size. You can also use the “Chart editor” and select “Customize” to change the title font size and other formatting options.
Conclusion
To make the graph title smaller in MATLAB, you can adjust the title’s font size using the set function or by specifying the FontSize property directly within the title() function. This ensures the title remains readable while not overpowering the rest of the plot.
For instance, you can reduce the title size like this:
matlabCopyEdittitle('Your Graph Title', 'FontSize', 10);
This allows for better control over the appearance of your graph, ensuring that the title complements the overall design without overwhelming the visual space.
