

How Data Analysis and Automation Are Improving Modern Beverage Production
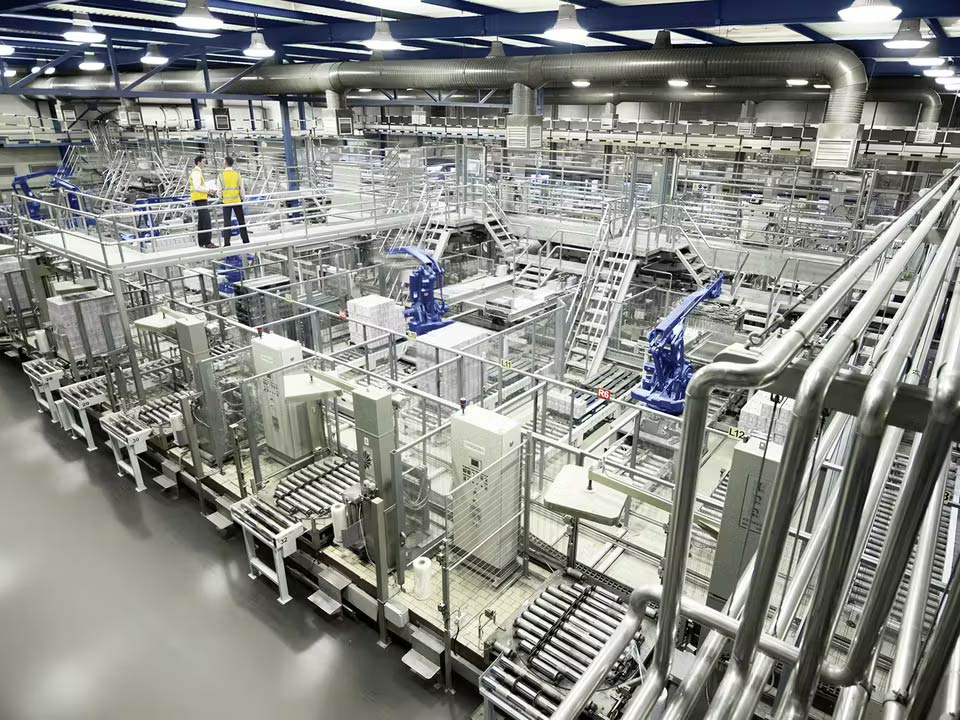
Modern manufacturing is becoming increasingly dependent on automation, sensors, and data-driven decision-making. This is particularly visible in the beverage industry, where production lines must handle large quantities of liquid products while maintaining consistent quality, accurate filling levels, and reliable packaging.
Although beverage production may appear to be primarily mechanical, modern systems generate a significant amount of operational data. Production speed, filling accuracy, machine downtime, temperature, pressure, and product flow can all be monitored and analyzed. When automation is combined with data analysis, manufacturers can make better decisions and improve the performance of their production lines.
The Role of Automation in Beverage Manufacturing
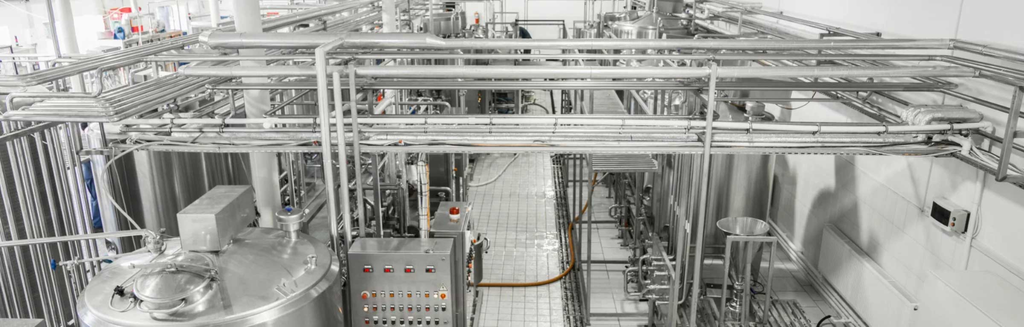
A modern beverage production line can involve several interconnected processes. Containers may need to be cleaned, filled, capped, labeled, inspected, and packaged before finished products are ready for distribution.
Automation allows these processes to work together with less manual intervention. Sensors and control systems can monitor individual stages and provide information to operators when a parameter moves outside its expected range.
For example, a filling system can monitor container positioning and filling conditions while automated controls regulate the operation. This helps manufacturers maintain greater consistency from one production cycle to another.
Modern beverage filling systems are also designed for different product characteristics. Water, juice, carbonated drinks, energy beverages, and other liquids may require different filling approaches. Selecting the appropriate beverage filling machine can therefore have a direct effect on production efficiency and product consistency.
Why Production Data Matters
One of the biggest advantages of automated manufacturing is the amount of information that can be collected during production.
A factory can potentially track measurements such as:
- Production rate
- Filling accuracy
- Equipment operating time
- Machine stoppages
- Temperature and pressure
- Product losses
- Reject rates
- Maintenance events
Individually, these measurements provide useful information. However, their real value becomes apparent when they are analyzed together.
Suppose a production line experiences repeated short stoppages during certain periods. Looking only at the total production output might not reveal the cause. A closer analysis of machine events, production speed, and downtime records could identify a recurring pattern.
This is where data analysis becomes an important part of industrial decision-making.
Using MATLAB Concepts in Industrial Applications
Tools used for numerical computing and data analysis can be valuable when manufacturers need to understand production information.
MATLAB, for example, can be used to work with datasets, visualize trends, perform calculations, and develop analytical models. Engineers can use these capabilities to examine production measurements and identify relationships that may not be obvious from raw data.
A simple production dataset could contain timestamps, production rates, machine temperatures, filling measurements, and downtime events. Plotting these variables can help engineers identify unusual changes or recurring patterns.
For larger operations, analytical models can also support predictive maintenance. Instead of waiting for a machine component to fail, engineers can study historical operating data and look for conditions associated with previous failures.
This approach can help manufacturers move from reactive maintenance toward more proactive equipment management.
Connecting Data Analysis With Production Equipment
Data analysis is most useful when it is connected to the physical manufacturing process. A graph showing a production decline is helpful, but understanding which machine or process caused that decline is even more valuable.
This is why modern production systems increasingly combine machinery, sensors, control systems, and monitoring software.
For example, a beverage line may operate at a specific production rate for several hours. If output gradually decreases, operators can examine equipment data to determine whether the issue is related to the filling process, container handling, capping, or another stage.
Integrated beverage bottling equipment can combine multiple stages of the bottling process, including filling and capping, into a more streamlined production system. When such equipment is supported by appropriate monitoring and analysis, manufacturers can gain a clearer understanding of overall line performance.
Improving Efficiency Through Better Analysis
Efficiency is not simply about making a machine operate faster. Increasing speed without maintaining accuracy or product quality can create additional waste and operational problems.
A better approach is to consider several variables simultaneously.
Manufacturers can compare production output with downtime, reject rates, filling accuracy, and maintenance events. This makes it possible to identify whether an apparent improvement in speed is actually producing better overall performance.
Data visualization can make these relationships easier to understand. Time-series graphs, statistical analysis, and comparative charts can help engineers identify production trends and investigate unexpected changes.
The same principle applies to quality control. If filling measurements are recorded over time, statistical analysis can reveal whether the process is stable or whether variation is increasing.
The Future of Data-Driven Manufacturing
As industrial automation develops, the relationship between machinery and data analysis will become increasingly important. Sensors are becoming more common, control systems are becoming more sophisticated, and manufacturers have access to larger quantities of operational information.
The next step is not simply collecting more data. It is using that data effectively.
Engineers who understand both manufacturing processes and analytical tools can help companies turn production information into practical improvements. Whether the goal is reducing downtime, improving quality, optimizing production speed, or planning maintenance, data can provide valuable insight into how equipment is actually performing.
For beverage manufacturers in particular, combining automated filling and bottling technology with systematic data analysis can create a more measurable and efficient production environment.
The future of manufacturing will therefore depend not only on better machines, but also on better ways of understanding the information those machines generate.
